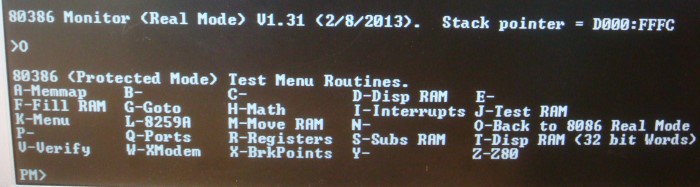
An 80386/80486 Monitor
Any 80386 S-100 board normally needs a built in monitor program to monitor its ability to interact with other S-100 bus boards. As with our 8086 monitor there are typically no space limitations, so more code can be added to allow much more hardware testing and configuration than you would normally see in say, a Z80 monitor for example. That said, it is usually desirable not to have the monitor ROM extend below the region found in an IBM-PC (F0000-FFFFFH). For example the PC Video board RAM is at A0000H- BFFFFH (and/or) C7FFFH-EFFFFH. Above F0000H everything is up for grabs for us. We will use this space here for extensive board system diagnostics, we will write our own code to emulate standard PC calls so the software "thinks" it is talking to an IBM-PC. To do this we need quite a bit of space. Our 80386 monitor therefore will start at F0000H with much of the code space up to FFFFFH filled with true monitor type commands.
The basic monitor (in ROMS) will work in "Real Mode" (RM) with any 8088, 8086, 80816 and 80286. However what is special about this monitor is the Protect Mode (PM) feature of the 80386. In this mode the CPU utilizes its full 32 bit capacity and can address RAM up to 4GB directly. This is an enormous amount of RAM, equivalent to that of many mainframes of its day. Likewise the 32 bit registers provide enormous capacity and capability. To give you some idea of the size, a simple DEC EAX instruction starting with 0FFFFFFFFH at 16 MHz will take over 3 hours to get to zero!
The 80386 is a schizophrenic chip, upon reset it behaves much like your traditional 8086 CPU with its 16 bit segments and 16 bit registers. In this mode called "Real Mode" (RM), it is capable of only addressing up to 1MB of RAM. To switch the CPU into 32 bit "Protected Mode" (PM), there are some fairly complicated operations that must be first carefully carried out. This is because in PM the CPU exhibits a very sophisticated memory management process which allows sophisticated operation systems to run multiple users and tread operations.
This article is meant to introduce you as to how to program the chip for this purpose and allow you to utilize the full 32 bit power of the 80386 CPU. Its end point however is still a single user "flat" address space of up to 4GB of RAM. Even more work is required to implement multi-user and paging systems.
The Segment Registers
In a certain sense you are almost better off not knowing about the segment registers of the 8086 to understand them on the 80386. For the 80386 in PM, the 16 bit segment registers (CS, SS, DS, ES, FS, GS) are nothing more than 16 bit pointers to a tables in RAM that describes a region of memory that all the 32 bit 80386 registers in PM will use. This most importantly, includes the 32 bit instruction pointer EIP for the CS. The table tells the CPU (amongst other things), for example where in the actual physical RAM space the CS starts at. In other words where in RAM an EIP = 0 actually resides. Intel calls these tables "Descriptor tables" . So for an EIP = 354H and a CS descriptor table
configured with its starting address of say 12000H, the CPU would actually look at RAM at 12345H. Gone are CS address bit shifts/additions etc.
There has to be a descriptor table for every segment register in RAM before it is used. Typically there are not many, usually one or two per segment
register. The descriptor tables (for different segments), are usually all bunched together at one location called the Global Descriptor Table (GDT). As we will see, each segment table requires 8 bytes of RAM. So we may have CS = 8H point to that descriptor, DS = 16H point to that descriptor, SS = 20H point to that segments descriptor, and so on. Most segment values for 80386 programs have low numbers (unlike 8086 code) because the index into a table (the GDT) is typically small. For example we might have defined in the GDT #1 with:-
MOV AX,1
MOV CS,AX
What you would not normally have is AX = 1200H as you probably not have a table of 1200H CS descriptor tables.
Clearly the location of this important GDT is very critical to the 80386 when it runs in PM. Before switching the CPU to PM, a special register (the Global Descriptor Table Register), must be loaded with its location. This location is defined by another location in RAM that contains just two items, the total size in bytes of the complete GDT, and its location. The reason for the double pointer is because it easily allows GDT tables to be switched/modified on the fly. The special 80386 instruction LGDT does this.
Here is a typical code example:-
LGDT [dword CS:GdtDesc] ;Load the PM GDT
GdtDesc:
DW GDT_SIZE - 1 ;GDT limit
DD GDT_BASE_ADDRESS ;GDT base address (Note, relocated to 0D0000H in RAM
by the Monitor)
Its important to note that before any protect mode segment register is used in PM (including the SS register) , you must point them to a valid GDT entry. Its fine (indeed common) for different segment registers to share the same GDT index number.
Let us quickly look at how these segment descriptors are defined. First they are nothing more that eight consecutive 8 byte memory locations. Normally all GDP tables are positioned one after the other in RAM. The layout of each 8 byte destructor is a little screwed up in terms of the position/order of the data within them. This is due to the fact that they were built on to the structure of the earlier 16 bit 80286 descriptors. In order to keep software compatible the extra information required for
the 80386 descriptors was tagged on.
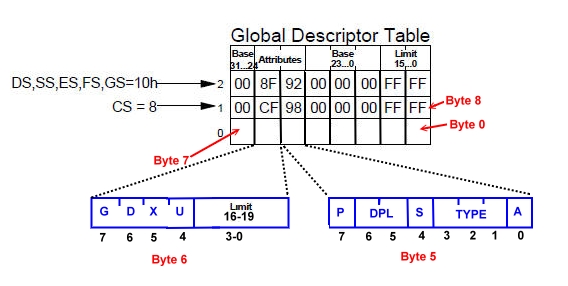
Here is an example of the lowest three entries of a typical GDT:-
Lets skip the first 8 byte entry in the table for the moment. Each square is a byte of RAM. The positions 0-7 bytes read right to left with the lowest (first) GDT byte being in the lowest right hand corner of the table. As you can see the CS descriptor starts at byte position #8 in the total GDT. So we would load 08H into the CS register.
Each descriptor defines where in the 80386's 4GB address space the segment (CS, SS ES, etc) actually starts in physical RAM. Initial entries in the GDT are often 00000000H, but remember it can be any number. We could have a CS assigned to an absolute RAM location of 123456H yet the ORG .A86 code can be 0H. The 80386 will do the address translation of the final EIP on the fly. We clearly need a 32 bit starting address number. As I said above this number is not linear. Bytes 2-4 contain bits 0-23 of the starting address, byte 7 contains the remaining bits 24-31.
The next thing we need is information to define how much of the 80386's address space is "assigned" to that segment. It can be any number from 1 to 4GB you call, but if your program should go outside of this region you will generate a PM fault (see below) except in very special (defined) situations.
You might think we need another 32 bit number, but the 80386 does a trick, we can define this size in 1 byte or 4K units by the status of a one bit (the granularity bit, see below) thereby reducing the RAM requirement to 2 and 1/2 bytes. Two of the bytes are the
first two bytes (0 & 1) of each descriptor table which are 0-15 bits of the segment limit. The requires next 4 bits (16-19) are shoehorned into the lower 4 bit nibble of byte 6 (see above). Not pretty but it saves space.
So far things are fairly simple and straightforward. Bytes 5 and 6 are a little bit more complex. These bits have important defined meanings as to how the 80386 will work within that data
or code segment. Working our way through the 12 bits they have the following meanings:-
Byte 5, Bit 0. The "A" or access bit is seldom used. It is one of the reasons the GDT is in RAM in most systems. It is usually initialized to 0 but changes to 1 any time the 80386 access the segment. If it is set back to 0 by software it is reset to one whenever that RAM segment is re-accessed. Its main use is in multiuser/memory paging operations. We will not use this capability here.
Byte 5, Bits 1-4. The "Type" bits on the other hand are very important. They define the nature of the information in that segments RAM. This table shows their meaning
|
| 000 | Data (Read Only) |
|
| 001 | Data (Read & Write) |
|
| 010 | Stack (Read Only) |
|
| 011 | Stack (Read & Write) |
|
| 100 | Code (Execute Only) |
|
| 101 | Code (Execute & Read) |
|
| 110 | Code (Execute only, Conforming) |
|
| 111 | Code (Execute & Read, Conforming) |
A value of 100 and 001 are by far the most common. The former tells the 80386 that segments RAM is reserved for program code and will never be altered by that (or another program). The 001 bit configuration on the other hand is the inverse. It is reserved for RAM data, can be accessed by most registers and can be altered. The other bit combinations we will skip for now they are used in special Read Only (ROM like) modes or where interrupts/Gates with different privilege levels are implemented. For our purposes 001 can be used for all the DS, ES, FS, GS and even SS segments.
Byte 5, Bit 4. This is the "S" (System) bit and is used in Multiuser/Operating system applications etc. For our use it will always be a 1.
Byte 5, Bits 5,6 These are the "Privilege Level" bits. The 80386 can run programs at four different privilege levels numbered 0 to 3. A program in a segment at one privilege level cannot access data or code at a higher privilege level except by using special interrupts and "gates". This very important function protects one program from overwriting another things for things like a program overwriting the operating system. These privilege levels are numbered 0 (the highest) to 3 (the lowest). The levels match exactly bits 5 & 6 of the segment descriptor. The 80386 comes up in PM at its highest privilege level (level 0). We will run all our code in the 80386 monitor at the highest Privilege level, level 0.
Byte 5, Bit 7. This is the "P" (Present) bit and is used for Page mode switching in Multiuser/Operating system applications etc. For our use it will always be a 1. If it is 0, it tells the CPU that the address range that selector defines is not actually present in physical RAM (is on a disk buffer).
Byte 6, Bit 4. The "U" or user bit, is as so named. Used by operating systems etc. We will not use it here and is set to 0
Byte 6, Bit 5. The "X" is the opposite. It is an Intel Reserved bit and should not be used at all. Is set to 0.
Byte 6, Bit 6 This is the "D" or default code size bit is a very important bit. If 1 (common for PM), it tells the 80386 that all code and data will be understood by the 80386 to be 32 bit code and treated as such in terms of register usage UNLESS the special 80386 opcode prefixes (o16 in NASM, 66H) forces code or data in the segment to be interpreted as 16 bit code. Exactly the opposite if the "D" bit is a 0, in this situation the 80386 assumes by default that all code refers to 16 bit registers. Again this CAN be overwritten by using a special 80386 opcode prefix (o32 in NASM).
Its very important to understand that the 80386 can interpret SAME opcodes in RAM differently depending on how the segment is configured with this bit. So the code:-
B8,00,00,00,00 in 32 bit mode will zero the EAX register. In 16 bit mode if you wanted to zero EAX you would use the 66H prefix opcode. The assembler would write 66,B8,00,00,00,00.
Conversely B8,00,00 in 16 bit mode will zero the AX register. In 16 bit mode if you wanted to zero EAX you would use the 66H prefix opcode. The assembler would write 66,B8,00,00,00,00.
Likewise for register based addressing. In this case the byte 67H before an opcode forces/overrides the next opcode addressing bytes to be 16 bits for a 32 bit selector and 32 bits for a 16 bit selector.
Fortunately we don't normally have to worry about things like this because we tell the assembler the type of code we want.
For NASM we use [BITS 16], [BITS 32], and o16, o32 opcode prefixes if needed. All the above is more or less transparent, but you must be careful to have your selector "D" bit match your [BITS 16] or more common, [BITS 32]
Byte 6, Bit 7 This is the "G" or granularity bit we talked about above. If 0 the 20 bit Segment size limit is measured in 1 byte units. If 1 they are measured in 4K units.
Taking all of the above bit patterns into account the most common values of bytes 5 & 6 for CS segments is 9ACFH and for other segments 92CFH.
We are almost done with the GDT, the only remaining is the very first descriptor in the table -- the first eight bytes. Intel reserves this descriptor as a special designation to identify an invalid segment. All eight bytes are always
set to 0's and while not required, any unused/invalid segments in your code can be assigned a segment value of 0.
OK, so in our travels of switching the 80386 into protected mode we must first setup (in RM) a GDT in RAM and load the pointer of this table into the 80386 GDT register. Here for example is the complete GDT of my 80386 monitor.
;80386 DESCRIPTOR TABLES
ALIGN 16 ;More efficient
Gdt: DD 0 ;GDT[0]: Null entry, never used.
DD 0
;GDT[1]:Executable, read-only code, base address of 0, limit FFFFF
;granularity bit (G) set (making the limit 4GB)
DW 0FFFFh ;Limit[15..0]
DW 0000h ;Base[15..0]
DB 00h ;Base[23..16]
DB 10011010b ;P(1) DPL(00) S(1) 1 C(0) R(1) A(0)
DB 11001111b ;G(1) D(1) 0 0 Limit[19..16]
DB 00h ;Base[31..24]
;GDT[2]: Writable data segment, same address space as GDT[1].
DW 0FFFFh ;Limit[15..0]
DW 0000h ;Base[15..0]
DB 00h ;Base[23..16]
DB 10010010b ;P(1) DPL(00) S(1) 0 E(0) W(1) A(0)
DB 11001111b ;G(1) B(1) 0 0 Limit[19..16]
DB 00h ;Base[31..24]
;GDT[3]: Executable, read-only 16 bit code, base address of 0, limit FFFF
;granularity bit (G) set (making the limit 64K)
DW 0FFFFh ;Limit[15..0]
DW 0000h ;Base[15..0]
DB BASE_16_BIT ;Base[23..16] (>>>> Note base is @ F000:0H <<<<)
DB 10011010b ;P(1) DPL(00) S(1) 1 C(0) R(1) A(0)
DB 00000000b ;G(0) D(0) 0 0 Limit[19..16]
DB 00h ;Base[31..24]
;GDT[4]: Writable data segment, 16 bit code, base address of 0, limit of FFFFh.
DW 0FFFFh ;Limit[15..0]
DW 0000h ;Base[15..0]
DB BASE_16_BIT ;Base[23..16] (>>>> Note base is @ F000:0H <<<<)
DB 10010010b ;P(1) DPL(00) S(1) 0 E(0) W(1) A(0)
DB 00000000b ;G(0) B(0) 0 0 Limit[19..16]
DB 00h ;Base[31..24]
;GDT[5]:Executable, read-only code, base address for IDT is IDT_BASE
;granularity bit (G) set (making the limit 4GB)
DW 000Fh ;Limit[15..0] (16*4K)
DW 0000h ;Base[15..0]
DB IDT_BASE ;Base[23..16]
DB 10011010b ;P(1) DPL(00) S(1) 1 C(0) R(1) A(0)
DB 11001111b ;G(1) D(1) 0 0 Limit[19..16]
DB 00h ;Base[31..24]
GDT_SIZE EQU ($ - Gdt) ;<<<< Size of GDT, in bytes
GdtDesc: ;<<< GDT descriptor >>>
DW GDT_SIZE - 1 ;GDT limit
DD GDT_BASE_ADDRESS ;GDT base address (Note, relocated to 0D0000H in RAM above)
Don't worry about some of the later segment descriptors for now they will make more sense later. We have one more thing to do before we fire up PM. We need to transfer the above table in ROM to RAM not only so that the "A" bit can be set but more importantly so the GDT in RAM can be modified or added to by software. A typical 8086 string move instruction does this. I place the 8038 Monitor GDT at D0000H in RAM with the following code:-
CLD ;Clear direction flag
CLI ;Just in case
MOV AX,GDT_SEG ;Will move the GDT tables to D000:0H in RAM
MOV ES,AX
MOV DI,GDT_OFFSET ;<----- Will place GDT at 0D0000H in RAM
MOV AX,CS ;Actually not needed here (CS=DS), but want general case
MOV DS,AX
MOV SI,Gdt
MOV CX,GDT_SIZE
INC CX ;Move tables to 0D000:0H RAM location
REP MOVSB ;[DS:SI] -> [ES:DI]
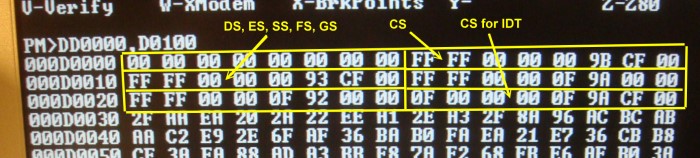
Here is how the GDT table appears in RAM:-
We now have our complete GDP at location GDT_BASE_ADDRESS (D0000H) in RAM. We tell the 80386 about this location by loading the GDT register:-
CPU 386 ;Allow 80386 Opcodes
o32 LGDT [dword CS:GdtDesc] ;Initialize GDTR (for GdtDesc, see below)
The 80386 has a special 32 bit register call CR0 which
is actually largely unused on the 80386. There are a few bits for use with the math co-processor but it is its bit 0 that is important to us
here. If bit 0 of register CR0 is 0 the CPU operates in RM. If this bit is changed to 1 the CPU immediately switches to PM.
MOV EAX,CR0 ;Set to protected mode
OR EAX,1
MOV CR0,EAX ;<---- GOTO PROTECTED MODE
;The CPU is now executing in 16-bit protected mode.
;Make a far jump in order to load CS with a selector
;to our 32-bit executable code descriptor GDT[1] (see above).
o32 JMP dword PM_CS_386:(PM_ROM_BASE+Start32) ;PM_CS_386=8 in GDT
[BITS
32]
;<<<<<<< We now need to use 32-bit instructions >>>
Start32:
MOV AX,PM_DS_386 ;GDT[2]: Writable (0-4GB)
MOV DS,AX
MOV ES,AX
MOV FS,AX
MOV GS,AX
MOV SS,AX
MOV ESP,STACK_SEG ;Get real mode current SP to ESP
SHL ESP,4
MOV EBX,STACK_POINTER
ADD ESP,EBX ;Force to 000DFFFCH
MOV EBX,SMSG_PROTECTED
call P_SPEAK_STRING ;Speak out the message "Protected Mode" (32 Bit Code)
......
The above code has a lot going on. Upon switching over to Protected Mode (PM) we immediately do a Far Jump.
This is required to flush out the queue of bytes in the CPU and force a new code segment loading. We jump to Start32: in RAM. This is where our descriptor table first comes in. Rather than having something like a RM JMP dword F000:Start32, where the CS is loaded with F000H the code segment is loaded with just PM_CS_386 which is in our case here is 8. It is the 8th byte in our GDT. Because we how have the CS with this descriptor we can have in theory code up to 4GB in size. Because that descriptor is Byte 6, bit 6 set to one the CPU will expect and run the code in 32 bit mode. Because Byte 5, Bits 5,6 are 0's the code will run at the highest Privilege level with all possible opcodes/operations available to the CPU.
We use the o32 opcode prefix before this JMP because the 80386 is currently running in 16 bit mode before it gets to Start32:
Finally we must add the 32 bit PM_ROM_BASE (E0000H) to Start32 because the NASM assembler was setup with an ORG of 0. This was done so 16 RM and 32 bit PM code an be contained in the same program/ROM.
We next assign segment descriptors to all the other segments. In our case we will use the same (0-4GB) segment for all segments. We will hard wire in the ESP so it is the same as the real mode SS:SP.
That's all there is to it! If you write modules below:
CPU 386 ;Allow 80386 Opcodes
[BITS 32] ;32 Bit code
you can add any amount of code/data you like up to a limit of 4GB.
Interrupts
Such a system is fine if you do not need to use hardware and/or software interrupts. On the 80386 interrupts are extremely useful. Not only will they allow you flag the various memory management errors you make but you can use them to single step and debug hardware or software in a manner not available on the previous Intel CPU's.
Real Mode Interrupts.
If you recall the 8086 family ALWAYS set aside RAM from 0 to 3FFH as an
interrupt table for the 256 possible Interrupts the CPU could respond to.
Hardware (usually one or two 8259A's) or software INT's were spliced together
into a Jump table of 4 bytes per interrupt. The bytes contain the Segment:Offset to a routine for each interrupt. The routines themselves could be anywhere in the 1MB Address space.
After Reset and in RM, the 80386 follows this format exactly also. So for example we can load MS-DOS in RM from our 80386 monitor with no changes.
Protect Mode Interrupts.
PM Interrupts are a completely different animal. In PM, the INT Jump table no longer begins at 0H in RAM. It can in fact be anywhere in the CPU's 4GB Address space. All Jumps are sequentially listed in a
special table called the "Interrupt Descriptor Table" (IDT). There is only one IDT and as for the GDT
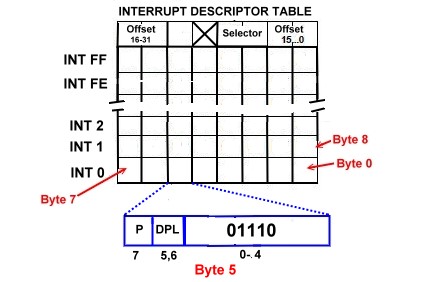
it is located in RAM (or ROM). Like the GDT, it is a sequence of 8 bytes, one 8 byte stretch for each of the possible 256 (0FFH) Interrupts. However the meaning of the bytes is quite different from those in the GDT. Here is the general layout of the IDT
Bytes 0,1. These two bytes contain bits 0-15 of the address (using the CS segment) of the interrupt routine for that interrupt.
Byte 2,3. These
two bytes contain the descriptor number for the CS segment for that interrupts interrupt routine
Byte 4. This byte is ignored by the 80386 and is set to 0.
Byte 5. This byte always has 01110 in bits 0-4. Bits 5 & 6 are the Privilege levels required to pass through the interrupt to that interrupts routine. It is not the privilege level of the routine itself. That is determined by the privilege level of the routines CS descriptor. For this reason it is common to have minimal DPL values (usually 3) so everything passes through. However since our 80386 monitor does not utilize protection levels, we will leave the field as 0. Bit 7 is the "P" or present bit. It is normally 1 indicating the Interrupt routine is available.
Byte 6,7. These two bytes contain bits 16-31 of the address (using the CS segment) of the interrupt routine for that interrupt.
We normally assign a region of RAM to all
Interrupt vector routines (pointed to by the IDT) by giving them their own descriptor and locating the interrupt routines within it. In my 80386 monitor from the above GDT we have:-
;GDT[5]:Executable, read-only code, base address for IDT is IDT_BASE
;granularity bit (G) set (making the limit 4GB)
DW 000Fh ;Limit[15..0] (16*4K)
DW 0000h ;Base[15..0]
DB IDT_BASE ;Base[23..16] (Int Routines at F0000-FFFFFH)
DB 10011010b ;P(1) DPL(00) S(1) 1 C(0) R(1) A(0)
DB 11001111b ;G(1) D(1) 0 0 Limit[19..16]
DB 00h ;Base[31..24]
I copy the actual IDT in the ROM to RAM at IDT_BASE (E0100H) with the following code.
;Next setup the IDT table
mov bx,IDT_SEG ;IDT_SEG starts at D000:100 to D000:900H in RAM
mov es,bx
mov bx,IDT_OFFSET ;Offset to start of IDT table
mov cx,100H ;All interrupts initially with a default error pointer
mov di,0
p_fill_ints: ;First fill with the default unassigned Int warning
mov ax,PM_INT_JUMP_TABLE ;Start of interrupt routines list (6 per int)
add ax,di
mov word [es:bx],ax ;Offset of unassigned int error routine in IDT
mov word [es:bx+2],PM_IDT_386 ;Protect mode 386 code segment for IDT jump table
mov byte [es:bx+4],0
mov byte [es:bx+5],10001110B ;P=1 (enable), DPL=0, 01110 = 80386 Interrupt Gate (8EH)
mov word [es:bx+6],0 ;Offset 31...16 (0, because PM_IDT_386 is at start of IDT)
add bx,8 ;Point to next int entry
add di,6 ;Point to next int error routine (note RM is only 5)
loop p_fill_ints ;Fill in all 256 entries
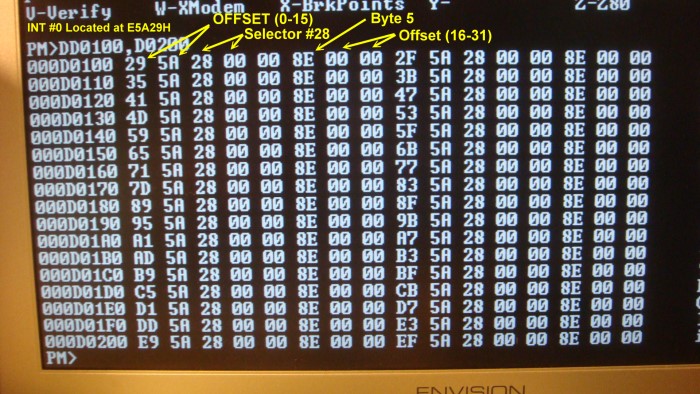
In the monitor each of the 256 possible Interrupt routines has its own routine. Most revert to a default routine. I will discuss this later. For now, suffice to say, each interrupt routine is space 6 bytes apart from PM_INT_JUMP_TABLE in the ROM. The above code will then build our IDT correctly in RAM at D0100H in RAM. Here is how the start of IDT table appears in RAM:-
We have one final thing to do, we need to let the 80386 know where the IDT is located. As for the GDT there is a special register and opcode to do this.
o32 LIDT [dword CS:IdtDesc] ;Initialize the IDTR (at E0100H)
Now whenever an interrupt occurs, the 80386 will go to the above interrupt table, call the appropriate interrupt routine and then return to what it was doing -- just as in RM.
Now let us look at the actual Interrupt routines that the 80386 Monitor uses. There are 256 of them. Most will be unused. We need a "Default" routine to handle the case where a rogue interrupt
occurred. We could have them all point to one memory location and use one general routine. However we would have no way of telling which interrupt was triggered. A non-expensive way, (code wise), to tag each interrupt uniquely is to push a unique byte digit (0-255) on the stack first and then jump to the generalized default routine. In that routine we pop the unique digit from the stack and display it.
This will require each INT routine to have a default form of:-
Int_X: Push (byte) X
jmp word PM_Default_INT_Routine
Int_Y: Push (byte) Y
jmp word PM_Default_INT_Routine
Int_Z: Push (byte) Z
jmp word PM_Default_INT_Routine
......
Here is the
relevant section of the 80386's default INT routine:-
PM_Default_INT_Routine: ;Unless told
otherwise all the above Ints will come here
PUSH EAX ;Save what will be changed. Note IRET saves flags
PUSH EBX
PUSH EBP
MOV EBP,ESP ;Locate Stack
MOV EBX,UNASSIGNED_1_INT_MSG ;"Un-assigned Int #"
CALL P_PRINT_STRING ;Note PRINT_STRING always uses the CS: override for the EBX pointer
MOV EAX,[EBP+12] ;Interrupt number was passed on stack here
CALL P_AL_HEXOUT ;Display Hex value in AL
MOV EBX,H_MSG_CRLF ;"H" + CRLF
POP EBP
P_INT_INFO_DONE:
CALL P_PRINT_STRING ;Display message at EBX
POP EBX
POP EAX
ADD ESP,4 ;Balance up stack, return
IRET
This is for the unused/unassigned INT's that
actually should not happen. The lower interrupt numbers (0-16) have fixed and well defined uses assigned by Intel. The behave exactly the same as all other interrupts but each has its own interrupt routine. Here is a list of these interrupts.
|
| Description | Int # | Return Address | Exception Type |
|
| Divide error | 0 | YES | FAULT |
|
| Debug exceptions | 1 | NO | TRAP |
|
| Breakpoint | 3 | NO | TRAP |
|
| Overflow | 4 | NO | TRAP |
|
| Bounds check | 5 | YES | FAULT |
|
| Invalid op-code | 6 | YES | FAULT |
|
| Coprocessor not available | 7 | YES | FAULT |
|
| Double fault | 8 | YES | ABORT |
|
| Coprocessor Overrun | 9 | NO | ABORT |
|
| Invalid TSS | 10 | YES | FAULT |
|
| Segment not present | 11 | YES | FAULT |
|
| Stack exception | 12 | YES | FAULT |
|
| General Protection | 13 | YES | FAULT/ABORT |
|
| Page fault | 14 | YES | FAULT |
|
| Reserved |
| |
TRAP |
| Coprocessor error | 16 | YES | FAULT |
For cases that are classified as "FAULT" or "ABORT" the CPU ends the routine in a HALT state with the 80386 Monitor. It can go no further and must be reset. Routines classified as "TRAP" can recover and will do so if requested by the operator. There are some
subtleties of what is passed on the stack for these routines. Please see the actual
code for details.
Note in the 80386 monitor the 8259A PIC hardware interrupts are relocated to INTs 40H-48H in PM. This is because the IBM-PC locations 8-16 are utilized by the 80386. The keyboard Interrupt (41H) can be tested in PM using the "L" command.
Debugging In Protected Mode
One of the main motivations for getting Interrupts working correctly in PM is that you can use the powerful interrupt driven debugging features of the 80386.
There are three features the 80386 comes with to facilitate debugging.
Int 3 Based Debugging
This is the old Intel single byte "CC debug opcode" debugging option. If you insert the single byte, 0CCH, anywhere in your code the CPU will
immediately do an Interrupt 3. This option goes back to the early Intel CPU's. Its was use a lot with software debuggers because you could
temporally substitute in a single byte in the code, cause the interrupt, display all the registers etc. and them put back the
original code and do the same thing for the next opcode. All the time single stepping the process along. If you are writing code yourself you can sprinkle the opcode at key points in the code to help you understand where things are
going. It's better than just sending a token character to the CRT! Int 3 is implemented in the 80386 monitor displaying all registers any time it is called.
Trace Flag Based Debugging
Bit 8 of the EFLAGS of the 80386 register is the "Trace Flag". This flag in normally 0. If it is changed to 1 then after EVERY complete instruction, the CPU does an immediate INT 1. This process is independent of any memory management, paging and
privilege levels etc. (of course the privilege set for the INT 1 routine itself may prevent its processing). The code segment and offset address pushed on
the stack will point to the next instruction following the one just executed. If the traced instruction changed the flow of control, the return address will point to the new address not the next one in the code listing. Because the EFLAGS register is also pushed on the stack its a little tricky to turn off the Trace flag in the INT 1 routine itself. You must reach up into its stack with something like:-
AND BYTE [SS:ESP+9],0EFH
IRET
Int 1 is implemented in the 80386 monitor displaying all registers any time it is called.
There are also two functions to turn off/on the trace mode which can be inserted into debugging code.
The 80386 Debug Registers
For the first time Intel added a true hardware set of Debug registers to the 80386. One of
the problems with the Trace flag approach is that you will find yourself tracing to much of what you have no
interest in. For example you typically have no interest in tracing through console or keyboard routines.
The 80386 supports a fairly
sophisticated debugging system. Let us first look at the Debug registers.
There are a total of 8 debug registers numbered DR0 to DR7. However DR4 and DR5 are unavailable on the 80386 and are reserved for later chips.
|
| Linear Address for
Breakpoint 0 | DR0 |
|
| Linear Address for Breakpoint 1 |
DR1 |
|
| Linear Address for Breakpoint 2 | DR2 |
|
| Linear Address for Breakpoint 3 | DR3 |
|
| | DR4 |
|
| | DR5 |
|
| B3, B2, B1, B0 | DR6 |
|
| G3,L3 G2,L2 G1,L1 G0,L0 | DR7 |
There are actually much more facilities in the debug control registers (DR7). You can
distinguish between code or data access, 1, 2 or 4 byte hits and more. Please consult the Intel manual for more information.
The last register is the Debug Status Register (DR6). Most of this register is unused. The lower 4 bits go from 0 to 1 depending which of the DR0-DR3 registers triggered the interrupt. In other words you use it to identify who called the breakpoint interrupt.
Here is an example of a display with the debugging menu option "X" being used.
The actual code to identify the breakpoint interrupt and suck down from the stack the
relevant information is a little tricky. Here is an example from part of the 80386 monitor.
Please note currently this breakpoint feature is quite rudimentary. The next
step will be to include step counts before asking to continue etc.
PM_TRACE_INT_Routine: ;>>>>> INT#1, Debug trace mode <<<<<<<
CALL P_DISPLAY_80386_REGISTERS ;Display Protect Mode Registers
PUSH EAX
PUSH EBX
PUSH ECX
PUSH EBP
MOV EBP,ESP
MOV EBX,IP_ADDRESS_MSG ;IP=
CALL P_PRINT_STRING
MOV EAX,[EBP+20] ;Get return IP address on stack
CALL P_EAX_HEXOUT ;Display HEX value in EAX
MOV EAX,DR6 ;Find out if a DR0-3 register triggered the INT
AND EAX,1 ;Was it DR0
JNZ NOT_DR0
AND EAX,0FFFFFFFEH ;Clear the bit 0
MOV DR7,EAX
XOR EAX,EAX
MOV DR0,EAX ;Clear DR0 Just in case
JMP P_DR_RESET
NOT_DR0:
AND EAX,2 ;Was it DR1
JNZ NOT_DR1
AND EAX,0FFFFFFFDH ;Clear the bit 1
MOV DR7,EAX
XOR EAX,EAX
MOV DR1,EAX
JMP P_DR_RESET
NOT_DR1:
AND EAX,4 ;Was it DR2
JNZ NOT_DR2
AND EAX,0FFFFFFFBH ;Clear the bit 2
MOV DR7,EAX
XOR EAX,EAX
MOV DR2,EAX
JMP P_DR_RESET
NOT_DR2:
AND EAX,8 ;Was it DR3
JNZ P_DR_RESET
AND EAX,0FFFFFFF7H ;Clear the bit 3
MOV DR7,EAX
XOR EAX,EAX
MOV DR3,EAX
JMP P_DR_RESET
P_DR_RESET:
MOV EBX,TRACE_CONTINUE_MSG ;"H,CR,LF,Continue to trace ?"
CALL P_PRINT_STRING
CALL P_CICO ;Get keyboard character and echo it
CMP AL,'Y'
JZ P_MORE_TRACE
CMP AL,SPACE ;For speed, allow space bar as well
JZ P_MORE_TRACE
CMP AL,ESC
JZ Start32 ;Reload everything Stack may be bad
AND word [EBP+28],0FEFFH ;Clear Trace Flag
CALL P_CRLF
JMP P_FINISH_TRACE
P_MORE_TRACE:
OR word [EBP+28],0100H ;Turn ON trace Bit
P_FINISH_TRACE:
POP EBP
POP ECX
POP EBX
POP EAX
ADD ESP,4 ;Balance up stack, return
IRET
Switching Back To Real Mode
To allow flexibility with the monitor its
useful to be able to go back and forth between real and protected modes. Going back to real mode from protected mode is essentially an unwinding of the above getting into protected mode process. You cannot however simply flip the CR0 bit 0 switch. This is because the CPU is in 32 bit mode and possibly currently above the 8086 address space. We must first
assign segments that do not extend past 1MG. We must also reassign the interrupt table to its real mode 0-3FFH in RAM location. The code below is the
relevant portion of the 80386 monitor that accomplishes that. The descriptors RM_DS_386 and RM_CS_386 are the two remaining entries in our GDT we talked about above.P_GOTO_REAL_MODE:
cli ;Just in case, disable interrupts.
;Need 16-bit Protected Mode GDT entries!
mov eax,RM_DS_386 ;16-bit Protected Mode data selector, GDT[4]: Writable (0-64KB)
mov ds, eax
mov es, eax
mov fs, eax
mov gs, eax
mov ss, eax
DB 0EAH
DW AtRealMode
DW 0H
DW RM_CS_386 ;<<<<< JMP 0F000H (or 0E000H base for debug mode)
[BITS 16] ;<<<< We now need 16-bit instructions here >>>>>>>>>>>>>
AtRealMode:
mov eax,cr0 ;Set real mode flag
dec eax
mov cr0,eax
JMP word ROM_BASE:AtRealMode2 ;Note "regular" FAR Jump
AtRealMode2:
o32 LIDT [dword CS:ridt] ;Initilize IDT back to real mode.
CPU 8086 ;Allow 8086 Opcodes only
mov ax,ROM_BASE ;Reset segment registers to 0.
mov ds,ax
mov es,ax
mov fs,ax
mov gs,ax
mov ax,STACK_SEG ;<<<< Note we assume we have RAM at this location >>>
mov ss,ax ;Normally SP is at E000:FFFCH
mov SP,STACK_POINTER ;E000:FFFCH, Assume we have RAM immediatly below this PROM
mov BP,BASE_POINTER
mov bx,SIGNON ;Signon notice
call PRINT_STRING ;Note up until now stack was not used
mov bx,SMSG_REAL
call SPEAK_STRING ;Speak out the message "Real Mode"
mov bx,SHOWSTACK ;Show current stack position
call PRINT_STRING ;Note up until now stack was not used
MOV AX,SS
CALL AX_HEXOUT
MOV CL,':'
CALL CO
MOV AX,SP
CALL AX_HEXOUT
CALL CRLF
JMP WARM_INIT ;Back to start of monitor in real mode
80386 Monitor Menu Commands
Many of the 80386 monitor menu commands are the same as the
8086 monitor. In fact
you can use the RM parts of this monitor with the
8088,
8086
and
80286 boards. So if the monitor is located in the MS-DOS Support board one
set of ROMS can be configured to work with all boards. It's fine to have
the MS-DOS Support board EPROMS "on all the time" (Jumper K7, 1-2) and use the
jumper on the CPU board (Jumper K3) to decide if the local or MS-DOS board will
be used for the boot monitor.
The monitor is over 15,000 lines of NASM code so it takes a little time to get
used to all its options. That said the menu commands should be familiar to
anybody that has used a typical microprocessor monitor in the past.
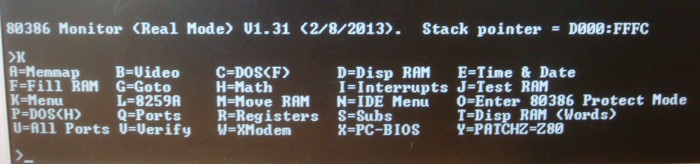
Here is the initial signon monitor using the "K" command to display the top
level commands
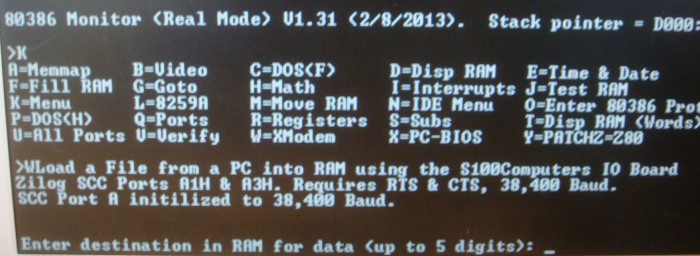
The "W" command may not be too obvious. This command allows you to
download a XModem binary file from say a PC and via the
Serial IO Board load it anywhere in RAM (up to 1M in RM, up to 4GB in
PM). Here is how the "W" menu option appears.
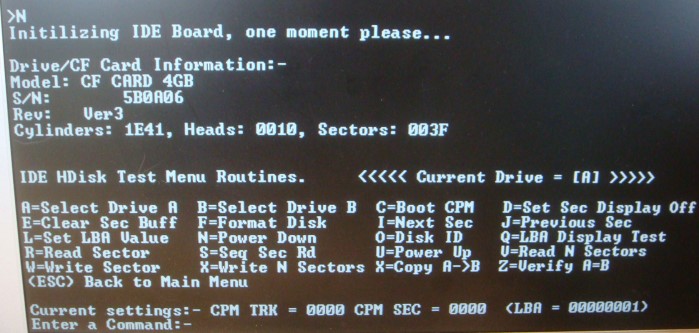
The "N" command brings up a sub menu containing an extensive list of menu
options to utilize the Dual IDE controller board. This also include the
ability to boot MS-DOS from a CF-CARD (or old fashioned Hard Disk).
Here is how the "N" sub-menu appears.
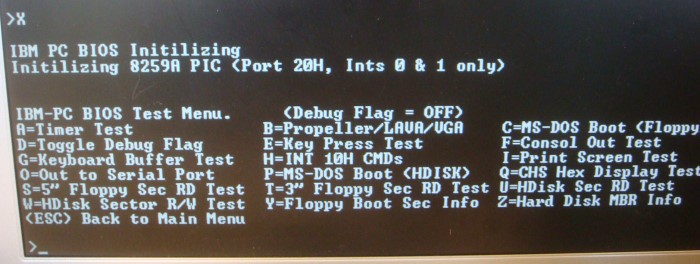
The "X" command brings up an extensive list of options to test and debug the
IBM-PC/MS-DOS BIOS functions. In particular it tests your interrupt
hardware (hard & soft) is working correctly. Here is how the "X" sub-menu
appears.
Finally the "O" command launches the 80386 into a sub-menu of PM commands.
Here is how the menu appears.
You can go back and forth between real and protected modes by continuously
pressing the "O" option. Many of the menu items are just the PM versions
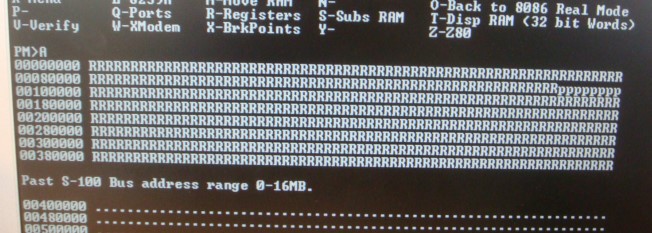
of the RM. For example here is the PM memory map ("A" Command) showing 4MG of
RAM in the system.
The "W" command in PM can be used to load a binary file directly into the
80386's 4GB address space (We have yet to make these high capacity DRAM
boards!). I must say it is impressive to move very large blocks of RAM (>
64K) around with a one line command. The "V" command likewise confirms
they are the same. The "X" command allows you to setup four distinct
code breakpoints. Should the CPU run into these locations it will dump all
registers as it single steps from there on.
About the 80386 Monitor Itself
The monitor consists of 4 main sections. Sections 1,2,& 3 will work with
any 8086 style CPU. Section 4 assumes an 80386
Section 1. This is a classical monitor. Display,
change RAM/ports etc.
Section 2. This is a self-contained set of
routines run diagnostic tests on the S100Computers IDE board.
Section 3. This fairly complex section. It
emulates most of the IBM-PC ROM BIOS interrupts (hard & soft) such that MS-DOS
(V4.01)/FreeDOS can be run on the system - without any DOS modifications.
Section 4. This is a section written in 32 bit
code. It requires an 80386 to run in Protected mode and has 0-4GB RAM addressing
capability as well as interrupt processing (IDT table). The code runs at
privilege level 0 with no assigned tasks.
In general the 32 bit specific routines for the 80386 all start with "P_" (e.g.
P_EAX_HEXOUT). These must be used when the CPU is in protected mode. The
most common error is calling a 16 bit routine instead of the equivalent 32 bit
one when the CPU is in protected mode. This will usually result in a FAULT
interrupt.
The final monitor in an EEPROM it will be placed at F000:0000H the stack is at D000:FFFCH &
IDE Board RAM buffers/BP at D000:E000H.
For debugging/testing this monitor will reside in RAM at E000:0000H (the stack
is still at D000:FFFCH & IDE RAM buffer/BP at D000:E000H).
I place the
stack an BP there so that test versions of the monitor can be uploaded to E0000H
by the monitor "W" command without overwriting the stack.
For mode (PM), the GDT is at D0000H and the IDT is at D0100-D08FFH.
The monitor needs a valid stack in RAM. It first checks if there is valid RAM in
high memory below the ROM (The EEROM is usually at F000:0000H). If so it will
set the SS to D000H and the SP to FFFCH. This puts it out of the way of
everything in low RAM. If it does not detect RAM there, it will search for a
valid segment from there in RAM downwards and put the stack at the first
"top of RAM" available.
That is the only RAM the main PM monitor needs. However the IDE drive diagnostic
routines require much more (sector buffers etc.) I have set the BP to E000H. We
use SS:BP throughout to access that RAM for the IDE Board diagnostic section.
Remember also, that RAM 0-3FFH can be initialized to trap all interrupts in RM.
If you want this, activate the SETUP_INT_TABLE routine at the start of
the code. Otherwise they are not used/activated unless you use the "L" and "I"
commands. In PM the ints are always active and will trap most errors and can be
used for single stepping debugging etc.
Most monitor commands are modeled after the old TDL/Zapple/Z80 commands. Because
we are now dealing with potentially up to 4GB of RAM for many commands, the
start, end RAM locations etc. can take up to 8 digits! In Protected
mode/80386, the actual span/range for any command is NOT limited to 64K as for
the 8086 monitor. In real mode however the limit is still 64K.
The following example fills RAM with 76H from 1A000H to 21234H.
F100000,200000,7676
Of course for the lowest 64K of RAM the "normal" 4,3,2 or 1 byte formats can be
used
F123,456,76
In general hitting the ESC key will abort any long display/command function.
In all cases, to accept data, finish the entry with a CR.
So if the display says "xxxxH" you enter up to 4 hex digits than a CR (No "H" is
required).
To test/load the monitor...
There are a number of ways to test/run this monitor. Until you actually have
this monitor in EEPROM, you can assemble it with a origin in low RAM (say
MonitorORG = 2000H). Until you have a working version you should have your 80386
(or 8086) after reset jump to the debugging monitor in low RAM. Click on
PCLOAD to see how to do this.
The debugging version can be anywhere in RAM but the easiest location is
something like 2000H. It needs to be well above 100H, because the Stack & Data
areas are BELOW the ORG or the final EPROM code. These may have to be assigned
different locations in the equates below if you don't have RAM at 0D0000H.
Assemble to a binary file with the excellent/free MSDOS/FreeDOS, NASM.EXE
Assembler
NASM -f bin 8086.A86 -o 8086.bin -l 8086.lst
This will make a 8 bit format .bin file
Move it across to your CPM80 disk file system (Telnet/Modem/serial connection),
whatever. I use my program
PCLOAD.COM. This is a small CPM program that takes an XModem file format
data from a PC (the above .bin file) via a serial port and places it in the S100
bus RAM anywhere from 1000H up to 1MG. For locations greater than 64K it assumes
a S100Computers Z80 CPU S100 board. This board has a 16K window capability to
access RAM > 64K. PCLOAD.COM can be downloaded from this web
site.
After switching to your 8086/80386 Board (IN port EDH), the CPU starting up
initially from an reset will begin at FFFF0H (F000:FFF0H) in RAM:. There you
should have code to jump to the start of the monitor. If for example it
resides in RAM at 2000H you should have the bytes:- EA 00
20 00 00.
BTW, in the monitor code before such a jump, there is a small piece of code that
reads bits 7 & 6 of the IOPORT and IF 0's
just outputs a character on the Console. This is a useful hardware test when you
are first building a board or testing hardware. See the end of the code here for
more info. However you don't need this code if you are doing things by hand i.e.
jumping to the start of the monitor in low RAM. Finally (if installed in
hardware), some diagnostic LED's can be turned on as the monitor loads. Again
not necessary, but useful.
Later when you have the EPROM monitor working, you can use the "Y" command will
move the code from low RAM (100H-E000H) up to E000:0000H (assuming you have RAM
there) and jump to the monitor at that location automatically. This saves a lot
of time if you are rewriting the monitor. However if you have the
S100Computers
Z80 board you don't need to do this the CPM PCLOAD program will
place the code anywhere you want it. Once you have the Monitor itself
working its own "W" command will read a modem serial port and upload a test
version of the monitor into RAM (currently) configured to start at E0000H. You
don't need CPM or the Z80 card. When done, use the Master Z80 monitor "W"
command to activate the 80386 board (not the "O" command) if your code is in
RAM.
Note in the code there are a few FAR JMP's in the code, and in PM there are
critical tables that must be positioned carefully. Be sure the equates near the
start of the code
have the correct values.
That said, the whole monitor fits easily within one 8086 style segment. So for
example it will run unchanged in RM at say: F000:0000H, E000:0000H,
1000:0000H.... etc. just make sure you have RAM below it configured for a stack.
PM mode requires careful positioning of the GDP and IDE tables.
As soon as you get things going, burn a EEPROM version that resides at
F000:0000H. After switching to your 80386/8086 Board (IN port EDH, Master Z80
monitor "W" or in this case "O" command), the Monitor should immediately come
up.
Remember the Console OUT routines CAN be different, The "Normal" monitor and IDE
diagnostic sections ALWAYS go through the Propeller driven (or any serial type)
Console out routine (CO: etc.). This by default is also the case when the
IBM-BIOS sections are activated. However if the Console output is redirected to
the CGA/VGA/Lava-10 board (INT 10H etc.), then CO: is not used. Instead CO: goes
to the IBM BIOS video board output. This is controlled by the [CONSOLE_FLAG]
byte in low RAM.
Likewise, the Console IN routines CAN be different. The "Normal" monitor and IDE
diagnostic sections ALWAYS go through the Propeller driven (or any serial type)
Console IN routine (CI:, CICO, etc.). However when the IBM BIOS section is
active (X Menu command, booting up MSDOS etc.), Keyboard input is ALWAYS
interrupt driven, and requires the 8259A PIC etc. It uses the input from the
propeller board, but each key press interrupt places the data in the IBM-PC
style RAM buffer for later retrieval. If the 8259A interrupt functions are not
working this section it will hang! You can use the 8259A diagnostics command
(Main menu, "L" command) to debug this section beforehand.
Burning EPROMS
To burn two 28C256 EEPROM's with a Wellon VP290 Programmer...
Load .BIN file. Select Even bytes (1st of 2) for one ROM and for the "Buffer Address"
and "From File HEX address"
leave them as 0000 in the dialog boxes, do not change "File Size (HEX) either".
Repeat for ODD addresses. Insert the ROM pair into the MSDOS Support
board and boot.
For the Baby 80486 board its easiest to use a Greenliant 29EE010 (128KX8)
chip.
In this case the monitor should start at 10000H withing the ROM, so the
single .bin file should have "To buffer Addresss" set to 10000.
The links below will contain the most recent versions of the above software.
Note, it may change over time and may not correlate exactly with the text in the article above.
For further reading I recommend the book "Advanced 80386 Programming Techniques"
by James L. Turley (Osborne McGraw-Hill)
Intel 80386
Programmers Reference Manual (1M
File)
MOST CURRENT VERSION .PDF FILE OF THE 80386/80486 MONITOR
(V1.74 9/15/2019)
MOST CURRENT VERSION OF THE 80386/80486 MONITOR
.ZIP File (V1.74
9/15/2019)
NASM Assembler
and Documentation (2/8/2013)
MOST CURRENT VERSION
OF THE 80386 MONITOR (.Zip Files)
(V10.4 1/2/2022)
MOST CURRENT VERSION
OF THE 80386 MONITOR (Visual C Text file)
(V10.4
1/2/2022)
This page was last modified on
01/02/2022